Inflation of the Co-Authorship Bubble

CoauthorInflationGraph2015-10-30.jpg Source of graphic: online version of the WSJ article quoted and cited below.

(p. A1) . . . , there has been a notable spike since 2009 in the number of technical reports whose author (p. A10) counts exceeded 1,000 people, according to the Thomson Reuters Web of Science, which analyzed citation data. In the ever-expanding universe of credit where credit is apparently due, the practice has become so widespread that some scientists now joke that they measure their collaborators in bulk–by the “kilo-author.”

Earlier this year, a paper on rare particle decay published in Nature listed so many co-authors–about 2,700–that the journal announced it wouldn’t have room for them all in its print editions. And it isn’t just physics. In 2003, it took 272 scientists to write up the findings of the first complete human genome–a milestone in biology–but this past June, it took 1,014 co-authors to document a minor gene sequence called the Muller F element in the fruit fly.
. . .
More than vanity is at stake. Credit on a peer-reviewed research article weighs heavily in hiring, promotion and tenure decisions. “Authorship has become such a big issue because evaluations are performed based on the number of papers people have authored,” said Dr. Larivière.
. . .
Michigan State University mathematician Jack Hetherington published a paper in 1975 on low temperature physics in Physical Review Letters with F.D.C. Willard. His colleagues only discovered that his co-author was a siamese cat several years later when Dr. Hetherington started handing out copies of the paper signed with a paw print.
In the same spirit, Shalosh B. Ekhad at Rutgers University so far has published 32 peer-reviewed papers in scientific journals with his co-author Doron Zeilberger. It turns out that Shalosh B. Ekhad is Hebrew for the model number of a personal computer used by Dr. Zeilberger. “The computer helps so much and so often,” Dr. Zeilberger said.
Not everyone takes such pranks lightly.
Immunologist Polly Matzinger at the National Institute of Allergy and Infectious Diseases named her dog, Galadriel Mirkwood, as a co-author on a paper she submitted to the Journal of Experimental Medicine. “What amazed me was that the paper went through the entire editorial process and nobody noticed,” Dr. Matzinger said. When the journal editor realized he had published work crediting an Afghan hound, he was furious, she recalled.
Physicists may be more open-minded. Sir Andre Geim, winner of the 2010 Nobel Prize in Physics, credited H.A.M.S. ter Tisha as his co-author of a 2001 paper published in the journal Physica B. Those journal editors didn’t bat an eye when his co-author was unmasked as a pet hamster. “Not a harmful joke,” said Physica editor Reyer Jochemsen at the Leiden University in the Netherlands.
“Physicists apparently, even journal editors, have a better sense of humor than the life sciences,” said Dr. Geim at the U.K.’s University of Manchester.

For the full story, see:
ROBERT LEE HOTZ. “Scientists Observe Odd Phenomenon of Multiplying Co-Authors.”The Wall Street Journal (Mon., Aug. 10, 2015): A1 & A10.
(Note: ellipses added.)
(Note: the online version of the story has the title “How Many Scientists Does It Take to Write a Paper? Apparently, Thousands.”)

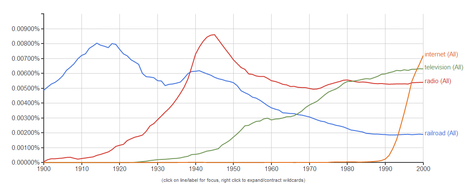
In 20th Century, Inventions Had Cultural Impact Twice as Fast as in 19th Century

NgramGraphTechnologies2013-12-08.png I used Google’s Ngram tool to generate the Ngram above, using the same technologies used in the Ngram that appeared in the print (but not the online) version of the article quoted and cited below. The blue line is “railroad”; the red line is “radio”; the green line is “television”; the orange line is “internet.” The search was case-insensitive. The print (but not the online) version of the article quoted and cited below, includes a caption that describes the Ngram tool: “A Google tool, the Ngram Viewer, allows anyone to chart the use of words and phrases in millions of books back to the year 1500. By measuring historical shifts in language, the tool offers a quantitative approach to understanding human history.”

(p. 3) Today, the Ngram Viewer contains words taken from about 7.5 million books, representing an estimated 6 percent of all books ever published. Academic researchers can tap into the data to conduct rigorous studies of linguistic shifts across decades or centuries. . . .
The system can also conduct quantitative checks on popular perceptions.
Consider our current notion that we live in a time when technology is evolving faster than ever. Mr. Aiden and Mr. Michel tested this belief by comparing the dates of invention of 147 technologies with the rates at which those innovations spread through English texts. They found that early 19th-century inventions, for instance, took 65 years to begin making a cultural impact, while turn-of-the-20th-century innovations took only 26 years. Their conclusion: the time it takes for society to learn about an invention has been shrinking by about 2.5 years every decade.
“You see it very quantitatively, going back centuries, the increasing speed with which technology is adopted,” Mr. Aiden says.
Still, they caution armchair linguists that the Ngram Viewer is a scientific tool whose results can be misinterpreted.
Witness a simple two-gram query for “fax machine.” Their book describes how the fax seems to pop up, “almost instantaneously, in the 1980s, soaring immediately to peak popularity.” But the machine was actually invented in the 1840s, the book reports. Back then it was called the “telefax.”
Certain concepts may persevere, even as the names for technologies change to suit the lexicon of their time.

For the full story, see:
NATASHA SINGER. “TECHNOPHORIA; In a Scoreboard of Words, a Cultural Guide.” The New York Times, SundayBusiness Section (Sun., December 8, 2013): 3.
(Note: ellipsis added; bold in original.)
(Note: the online version of the article has the date December 7, 2013.)

“Web Links Were Like Citations in a Scholarly Article”

(p. 17) Page, a child of academia, understood that web links were like citations in a scholarly article. It was widely recognized that you could identify which papers were really important without reading them– simply tally up how many other papers cited them in notes and bibliographies. Page believed that this principle could also work with web pages. But getting the right data would be difficult. Web pages made their outgoing links transparent: built into the code were easily identifiable markers for the destinations you could travel to with a mouse click from that page. But it wasn’t obvious at all what linked to a page. To find that out, you’d have to somehow collect a database of links that connected to some other page. Then you’d go backward.

Source:
Levy, Steven. In the Plex: How Google Thinks, Works, and Shapes Our Lives. New York: Simon & Schuster, 2011.

When Bibliometrics Are a Matter of Life and Death

(p. 51) . . . it is essential, if at all possible, to have a go-to physician expert and authority when one has a newly diagnosed, serious condition, such as a brain or, neurologic conditions like multiple sclerosis and Parkinson’s disease, heart valve abnormality. How do you find that individual doctor?
In order to leverage the Internet and gain access to state-of-the-art expertise, you need to identify the physician who conducts the leading research in the field. Let’s pick pancreatic cancer as an example of a serious condition that often proves to be rapidly fatal. The first step is to go to Google Scholar and find the top-cited articles for that condition by typing in “pancreatic cancer.” They are generally listed in order by descending number of citations. Look for the senior, last author of the articles. The last author of the top-listed paper in the Journal of Clinical Oncology from 1997 is Daniel D. Von Hoff, with over 2,000 citations (“cited by … ” appears at the end of each hit). Now you may have identified an expert. Enter “Daniel Von Hoff” into PubMed (www.ncbi.nlm.nih.gov/sites/pubmed) to see how many papers he has published: 567. Most are related to pancreatic cancer or cancer research.
(p. 52) Now go back to Google Scholar and enter his name, and you’ll see over 24,000 hits–this number includes papers that cite his work. There are some problems with these websites, since getting citations by other peer-reviewed publications takes time; if a breakthrough paper is published, it will be years to accumulate hundreds, if not thousands, of citations. Thus, the lag time or incubation phase of citations may result in missing a rising star. If it is a common name, there may be admixture of citations of different researchers with the same name, albeit different topics, so it is useful to enter in all elements including the middle initial and to scan the topic list to alleviate that problem. For perspective, a paper that has been cited 1,000 times by others is rare and would be considered a classic. In this example, the top paper by Von Hoff in 1997 is a long time ago, and he is no longer at the University of Texas, San Antonio-he moved to Phoenix, Arizona. How would you find that out? Look for Daniel D. Von Hoff using a search engine such as Google or Bing, and look up his profile on Wikipedia. Without any help from any doctor, you will have found the country’s leading authority on pancreatic cancer. And you will have also identified some backups at Johns Hopkins using the same methodology.

Source:
Topol, Eric. The Creative Destruction of Medicine: How the Digital Revolution Will Create Better Health Care. New York: Basic Books, 2012.
(Note: initial ellipsis added; parenthetical ellipsis in original.)