Myron Scholes on Sticking to His Ideas, Losing $4 Billion in Four Months, and Rejecting Taleb’s Advice

ScholesMyron2010-08-29.jpg

Myron Scholes. Source of photo: online version of the NYT article quoted and cited below.

(p. 22) The writer Nassim Nicholas Taleb contends that instead of giving advice on managing risk, you “should be in a retirement home doing sudoku.”
If someone says to you, “Go to an old-folks’ home,” that’s kind of ridiculous, because a lot of old people are doing terrific things for society. I never tried sudoku. Maybe he spends his time doing sudoku.

Some economists believe that mathematical models like yours lulled banks into a false sense of security, and I am wondering if you have revised your ideas as a consequence.
I haven’t changed my ideas. A bank needs models to measure risk. The problem, however, is that any one bank can measure its risk, but it also has to know what the risk taken by other banks in the system happens to be at any particular moment.
. . .
After leaving academia, you helped found Long-Term Capital Management, a hedge fund that lost $4 billion in four months and became a symbol of ’90s-style financial failure. .
Obviously, you prefer not to have lost money for investors.

For the full interview, see:
DEBORAH SOLOMON. “Questions for Myron Scholes; Crash Course.” The New York Times, Magazine Section (Sun., May 17, 2009): 22.
(Note: ellipsis added; bold in original versions, to indicate questions by Deborah Solomon.)
(Note: the online version of the article is dated May 14, 2009.)

FDR’s Taxes Deepened the Great Depression

Professor Ohanian is a UCLA economist well-known for his research on the Great Depression. Below I quote a few of his recent observations (with co-author Cooley):

(p. A17) In 1937, after several years of partial recovery from the Great Depression, the U.S. economy fell into a sharp recession. The episode has become a lightning rod in the ongoing debate about whether the economy needs further increases in government spending to keep employment from declining even more.
. . .
The economy did not tank in 1937 because government spending declined. Increases in tax rates, particularly capital income tax rates, and the expansion of unions, were most likely responsible. Unfortunately, these same factors pose a similar threat today.
. . .
. . . in 1936, the Roosevelt administration pushed through a tax on corporate profits that were not distributed to shareholders. The sliding scale tax began at 7% if a company retained 1% of its net income, and went to 27% if a company retained 70% of net income. This tax significantly raised the cost of investment, as most investment is financed with a corporation’s own retained earnings.
The tax rate on dividends also rose to 15.98% in 1932 from 10.14% in 1929, and then doubled again by 1936. Research conducted last year by Ellen McGratten of the Federal Reserve Bank of Minneapolis suggests that these increases in capital income taxation can account for much of the 26% decline in business fixed investment that occurred in 1937-1938.

For the full commentary, see:
THOMAS F. COOLEY AND LEE E. OHANIAN. “Gates and Buffett Take the Pledge; Wealthy businessmen often feel obligated to ‘give back.’ Who says they’ve taken anything?” The Wall Street Journal (Fri., AUGUST 20, 2010): A15.
(Note: ellipses added.)

That McGratten paper is:
McGrattan, Ellen R. “Capital Taxation During the U.S. Great Depression.” Working Paper 670, Federal Reserve Bank of Minneapolis, April 2009.

Tax Hike Would Hurt Entrepreneurs

(p. A17) When Congress returns from its summer recess, members will face a pivotal decision about the expiring Bush tax cuts. President Barack Obama has called for their permanent extension for singles with incomes below $200,000 and married couples with incomes below $250,000, but has proposed that most of the tax cuts for households with higher incomes be allowed to expire.
. . .
The fact that there are millions of people in the lower tax brackets with small amounts of business income may be interesting for some purposes, but it is irrelevant for the assessment of the economic impact of the tax hikes.
The numbers are clear. According to IRS data, fully 48% of the net income of sole proprietorships, partnerships, and S corporations reported on tax returns went to households with incomes above $200,000 in 2007.
. . .
Economic research supports a large impact. A pair of papers by economists Robert Carroll, Douglas Holtz-Eakin, Harvey Rosen and Mark Rider that were published in 1998 and 2000 by the National Bureau of Economic Research analyzed tax return data and uncovered high responsiveness of sole proprietors’ business activity to tax rates. Their estimates imply that increasing the top rate to 40.8% from 35% (an official rate of 39.6% plus another 1.2 percentage points from the restoration of a stealth provision that phases out deductions), as in Mr. Obama’s plan, would reduce gross receipts by more than 7% for sole proprietors subject to the higher rate.
These results imply a similar effect on proprietors’ investment expenditures. A paper published by R. Glenn Hubbard of Columbia University and William M. Gentry of Williams College in the American Economic Review in 2000 also found that increasing progressivity of the tax code discourages entrepreneurs from starting new businesses.

For the full commentary, see:
KEVIN A. HASSETT and ALAN D. VIARD. “The Small Business Tax Hike and the 97% Fallacy; The president’s plan to raise top marginal rates is holding back the very people who should be leading the economic recovery.” The Wall Street Journal (Fri., SEPTEMBER 3, 2010): A17.
(Note: ellipses added.)

One of the papers by Carroll et al, is:
Carroll, Robert, Douglas Holtz-Eakin, Mark Rider, and Harvey S. Rosen. “Income Taxes and Entrepreneurs’ Use of Labor.” Journal of Labor Economics 18, no. 2 (April 2000): 324-51.

The Hubbard paper is:
Gentry, William M., and R. Glenn Hubbard. “Tax Policy and Entrepreneurial Entry.” The American Economic Review 90, no. 2 (May 2000): 283-87.

Post-War Freedom, Not FDR’s New Deal or War, Ended Great Depression

(p. A17) Roosevelt died before the war ended and before he could implement his New Deal revival. His successor, Harry Truman, in a 16,000 word message on Sept. 6, 1945, urged Congress to enact FDR’s ideas as the best way to achieve full employment after the war.

Congress–both chambers with Democratic majorities–responded by just saying “no.” No to the whole New Deal revival: no federal program for health care, no full-employment act, only limited federal housing, and no increase in minimum wage or Social Security benefits.
Instead, Congress reduced taxes. Income tax rates were cut across the board. FDR’s top marginal rate, 94% on all income over $200,000, was cut to 86.45%. The lowest rate was cut to 19% from 23%, and with a change in the amount of income exempt from taxation an estimated 12 million Americans were eliminated from the tax rolls entirely.
. . .
Congress substituted the tonic of freedom for FDR’s New Deal revival and the American economy recovered well. Unemployment, which had been in double digits throughout the 1930s, was only 3.9% in 1946 and, except for a couple of short recessions, remained in that range for the next decade.
The Great Depression was over, no thanks to FDR. Yet the myth of his New Deal lives on. With the current effort by President Obama to emulate some of FDR’s programs to get us out of the recent deep recession, this myth should be laid to rest.

For the full commentary, see:
BURTON FOLSOM JR. AND ANITA FOLSOM. “Did FDR End the Depression?
The economy took off after the postwar Congress cut taxes.” The Wall Street Journal (Mon., APRIL 12, 2010): A17.

(Note: ellipsis added.)

“Disrespectful to Take Money from One Man’s Pocket and Put It in Another’s”

WestsideCommunityCenterColoradoSprings2010-08-30.jpg“A March fair to raise private funding for community centers, held at Westside Community Center, was sparsely attended.” Source of caption and photo: online version of the WSJ article quoted and cited below.

(p. A1) COLORADO SPRINGS, Colo.–Like many American cities, this one is strapped for cash. Tax collections here have fallen so far that the city has turned off one-third of its 24,512 street lights.

But unlike many cities, this one is full of people who are eager for more government cutbacks.
The town council has been bombarded with emails telling it to close community centers. Letters to the local newspaper call for shrinking the police department and putting the city-owned utility up for sale. A commission is studying whether to sell the municipal hospital. Another, made up of local businessmen, will opine on whether to slash the salaries and benefits of city employees.
“Let’s start cutting stupid programs that cost taxpayers a pot of money,” says Tim Austin, a 48-year-old former home builder now looking for a new line of work. “It’s so bullying and disrespectful to take money from one man’s pocket and put it in another’s.”

For the full story, see:

LESLIE EATON. “Strapped City Cuts and Cuts and Cuts.” The Wall Street Journal (Tues., APRIL 13, 2010): A1 & A16.

Employment Further Below Trend than Any Time in Half Century

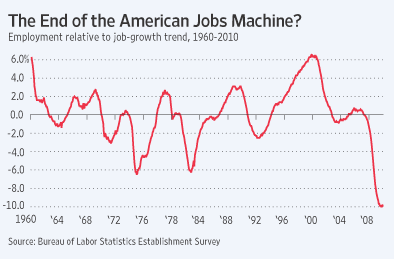
EmploymentRelativeToJobGrowthTrendGraph2010-08-05.gif

Source of graph: online version of the WSJ article quoted and cited below.

(p. A15) The number of nonfarm private jobs has been growing steadily since the 1950s. That number reached a peak at the end of 2007. Between 1958 and 2007, the number of U.S. jobs grew to 115.4 million from 43.5 million–about 2% per year on average. The steady upward trend reflects the long-run growth of the economy and increased participation in the labor force.

The nearby chart compares employment and that trend. It shows the percentage difference between employment and the trend line generated from monthly employment figures over the past 50 years (July 1960 through June 2010).
What we see is astounding. For almost 25 years–between 1984 and late 2008–the level of employment never fell to more than 3% below the trend line. Over that period, total employment grew by more than 36 million.
Employment fell briefly to about 6% below the trend during two previous recessions: in 1975 and again in 1982-1983. During those periods, the unemployment-rate peaks were 9% (in 1974) and 10.8% (in 1982). The unemployment rate in 2009 peaked at 10.1%.
By 2010, however, employment had fallen to about 10% below the trend, far below any previous level in the last half-century.

For the full commentary, see:
PAUL GODEK. “Jobless Numbers Are Worse Than You Think; The situation is much more dire now than it was during the 1980s.” The Wall Street Journal (Fri., JULY 23, 2010): A15.

Documenting Dangers of Growing Public Debt (and of Replacing History with Math)

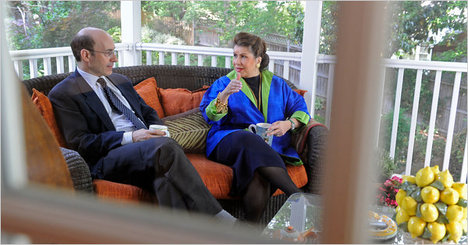
RogoffReinhart2010-08-04.jpg “Kenneth Rogoff and Carmen Reinhart at Ms. Reinhart’s Washington home. They started their book around 2003, years before the economy began to crumble.” Source of caption and photo: online version of the NYT article quoted and cited below.

(p. 1) Like a pair of financial sleuths, Ms. Reinhart and her collaborator from Harvard, Kenneth S. Rogoff, have spent years investigating wreckage scattered across documents from nearly a millennium of economic crises and collapses. They have wandered the basements of rare-book libraries, riffled through monks’ yellowed journals and begged central banks worldwide for centuries-old debt records. And they have manually entered their findings, digit by digit, into one of the biggest spreadsheets you’ve ever seen.

Their handiwork is contained in their recent best seller, “This Time Is Different,” a quantitative reconstruction of hundreds of historical episodes in which perfectly smart people made perfectly disastrous decisions. It is a panoramic opus, both geographically and temporally, covering crises from 66 countries over the last 800 years.
The book, and Ms. Reinhart’s and Mr. Rogoff’s own professional journeys as economists, zero in on some of the broader shortcomings of their trade — thrown into harsh relief by economists’ widespread failure to anticipate or address the financial crisis that began in 2007.
“The mainstream of academic research in macroeconomics puts theoretical coherence and elegance first, and investigating the data second,” says Mr. Rogoff. For that reason, he says, much of the profession’s celebrated work “was not terribly useful in either predicting the financial crisis, or in assessing how it would it play out once it happened.”
“People almost pride themselves on not paying attention to current events,” he says.
. . .
(p. 6) Although their book is studiously nonideological, and is more focused on patterns than on policy recommendations, it has become fodder for the highly charged debate over the recent growth in government debt.
To bolster their calls for tightened government spending, budget hawks have cited the book’s warnings about the perils of escalating public and private debt. Left-leaning analysts have been quick to take issue with that argument, saying that fiscal austerity perpetuates joblessness, and have been attacking economists associated with it.
. . .
The economics profession generally began turning away from empirical work in the early 1970s. Around that time, economists fell in love with theoretical constructs, a shift that has no single explanation. Some analysts say it may reflect economists’ desire to be seen as scientists who describe and discover universal laws of nature.
“Economists have physics envy,” says Richard Sylla, a financial historian at the Stern School of Business at New York University. He argues that Paul Samuelson, the Nobel laureate whom many credit with endowing economists with a mathematical tool kit, “showed that a lot of physical theories and concepts had economic analogs.”
Since that time, he says, “economists like to think that there is some physical, stable state of the world if they get the model right.” But, he adds, “there is really no such thing as a stable state for the economy.”
Others suggest that incentives for young economists to publish in journals and gain tenure predispose them to pursue technical wizardry over deep empirical research and to choose narrow slices of topics. Historians, on the other hand, are more likely to focus on more comprehensive subjects — that is, the material for books — that reflect a deeply experienced, broadly informed sense of judgment.
“They say historians peak in their 50s, once they’ve accumulated enough knowledge and wisdom to know what to look for,” says Mr. Rogoff. “By contrast, economists seem to peak much earlier. It’s hard to find an important paper written by an economist after 40.”

For the full story, see:
CATHERINE RAMPELL. “They Did Their Homework (800 Years of It).” The New York Times, SundayBusiness Section (Sun., July 4, 2010): 1 & 6.
(Note: the online version of the article is dated July 2, 2010.)
(Note: ellipses added.)

The reference for the book is:
Reinhart, Carmen M., and Kenneth Rogoff. This Time Is Different: Eight Centuries of Financial Folly. Princeton, NJ: Princeton University Press, 2009.
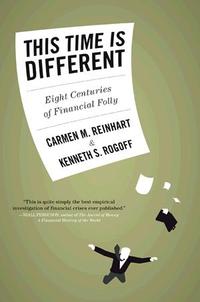
This-time-is-differentBK.jpg

Source of book image: http://www.paschaldonohoe.ie/wp-content/uploads/2010/02/This-time-is-different.jpg

“We’re Spending at a Rate that’s Just Unsustainable”

ShultzGeorgeVertical2010-07-5.jpg
George Shultz, former Dean of the University of Chicago Business School, former Secretary of the Treasury, and former Secretary of State. Source of photo: online version of the NYT article quoted and cited below.

(p. 12) What do you make of the direction the Republican Party has taken since you served in Washington? Isn’t the Tea Party a corruption of the values you stood for?
From what I understand of it, it is a reaction, which I share, to the fact that our government seems to have gotten out of control. We’re spending at a rate that’s just unsustainable.
That’s a legacy of the Bush era, I guess.
Everybody is conveniently blaming everything on Bush, but he’s not responsible for what’s happened in the last year.
You’ll be 90 in December. How are you?
I’m terrific. Feeling great. I’m vertical, not horizontal. That’s a big thing.

For the full interview, see:

DEBORAH SOLOMON. “Questions for George Shultz; The Statesman.” The New York Times Magazine (Sun., July 4, 2010): 12.

(Note: bolding of interviewer questions was in original.)
(Note: the online version of the article is dated June 28, 2010.)

Big Government Slows Economic Growth

(p. A15) Americans are debating whether to substantially expand the size of their government. As Swedish economists who live in the developed world’s largest welfare state, we urge our friends in the New World to look carefully before they leap.

Fifty years ago, Sweden and America spent about the same on their government, a bit under 30% of GDP. This is no longer true. In the years leading up to Sweden’s financial crisis in the early 1990s, government spending went as high as 60% of GDP. In America it barely budged, increasing only to about 33%.
While America was maintaining its standing as one of the world’s wealthiest nations, Sweden’s standing fell. In 1970, Sweden was the fourth richest country in the world on a per capita basis. By 1993, it had fallen to 17th.
This led us to ask whether Sweden’s dramatic increase in the size of government contributed to its sluggish growth. Our research shows that it did.
We surveyed the existing literature looking at the trade-offs between government size and economic growth throughout the world. While results vary, the most recent research, by Diego Romero-Avila in the European Journal of Political Economy (2008) and by Andreas Bergh and Martin Karlsson in Public Choice (2010) find a negative correlation between government size and economic growth in rich countries.
The weight of the evidence demonstrates that when government spending increases by 10 percentage points of GDP, the annual growth rate drops by 0.5 to 1 percentage point. This may not sound like much, but over 30 years this would result in the loss of trillions of dollars each year in an economy as large as America’s.

For the full commentary, see
ANDREAS BERGH AND MAGNUS HENREKSON. “Lessons From the Swedish Welfare State; New research shows bigger government means slower growth. Our country is a prime example.” The Wall Street Journal (Mon., JULY 12, 2010): A15.
(Note: the online version of the article is dated JULY 10, 2010.)

Mob Museum Financed from Local, State and Federal Tax Dollars

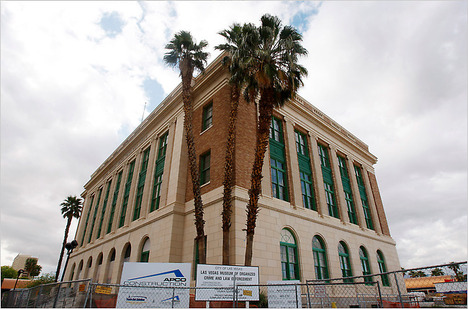
LasVegasOldFedCourthouse2010-05-19.jpg“The $42 million museum has been financed through a series of state, federal and local grants. It is set to open next March.” Source of caption and photo: online version of the NYT article quoted and cited below.

(p. 4) The idea for the Las Vegas Museum of Organized Crime and Law Enforcement was seeded when the city bought the 1933 federal courthouse and post office from the federal government for $1 in 2002, with the strict understanding that the building — one of the oldest in Southern Nevada — be used for cultural purposes.

For much of the middle of the last century, organized crime ruled the Strip, developing and managing an array of casinos, skimming their way to success. Federal prosecutors put an end to their reign in the 1980s. The city determined its historical relationship to organized crime — and the role the courthouse played in it — made the site a perfect fit.
. . .
The $42 million project has been financed through a series of state, federal and local grants, and the work has progressed a bit glacially as money has trickled in.
The project, once listed as one that could stimulate this city’s embattled economy, was attacked by Senator Mitch McConnell, the Republican leader, when city officials suggested that it might qualify for federal stimulus money.

For the full story, see:
JENNIFER STEINHAUER. “‘2 Mob Museums in Las Vegas, Ready to Go to the Mattresses.” The New York Times, First Section (Sun., April 25, 2010): 1 & 4.
(Note: ellipsis added.)
(Note: the online version of the article is dated April 24, 2010 and has the title “Vegas Mob Museums, Set to Go to the Mattresses.”)